Part II — From Physical to Digital · Chapter 06
A product has to keep being useful after its debut. Designing its maintenance means anticipating wear, growth, costs and conditions of use that launch barely lets us see.
Early in my career I learned that a product’s launch was the most important moment. Much of the effort was organized around it: understanding the user, translating their needs, choosing materials, solving manufacturing and getting the object to market. I still find that whole process wonderful. And yet I remember that we rarely paused, with the same enthusiasm, to think about who would maintain it, how it would age or what it would cost to keep it in working condition.
This chapter starts from that observation, which is a personal experience and not a universal rule of the profession. When the specification demanded maintenance — it happened to me on two projects I still remember clearly — the design changed: different materials, different joints, different access to parts. When it didn’t, maintenance was left for later, and in my experience that “later” almost never had the same budget, owner or date as the debut.
After walking through those two physical cases, the chapter crosses into the digital world: the economics of maintenance, the difference between handing over to production and sustaining an operation, how to estimate volume, what happens to margin when usage grows, how to design for an emergency day, how to map a three-year lifecycle and what is worth measuring to know what is aging. It ends with an idea I want to leave with you from the start: maintaining is also a product opportunity.

Most physical products are conceived for a long life cycle, and yet the design team tends to measure its success at the moment of debut. It’s understandable. Ideation is the most generous part of the craft: understanding the user, discovering what they need without being able to name it, turning it into form, material and process. I still think it is one of the most beautiful parts of working in product.
But those of us who design products are rarely taught to think long term, let alone about maintenance, unless it comes written into the specification. Profitability and delivery pressure concentrate attention on the release date: that’s where the money is invested, where the commitment to the customer sits, where the quarter closes. What happens eighteen months later belongs to another department, another budget or, often, to no one.
I tell this as personal experience, not as a verdict on all design education: plenty of schools and teams do it very well. In my case, maintenance showed up clearly when someone wrote it down as a requirement. Two products forced me to look beyond delivery, and I tell them next because they changed the way I ask questions.

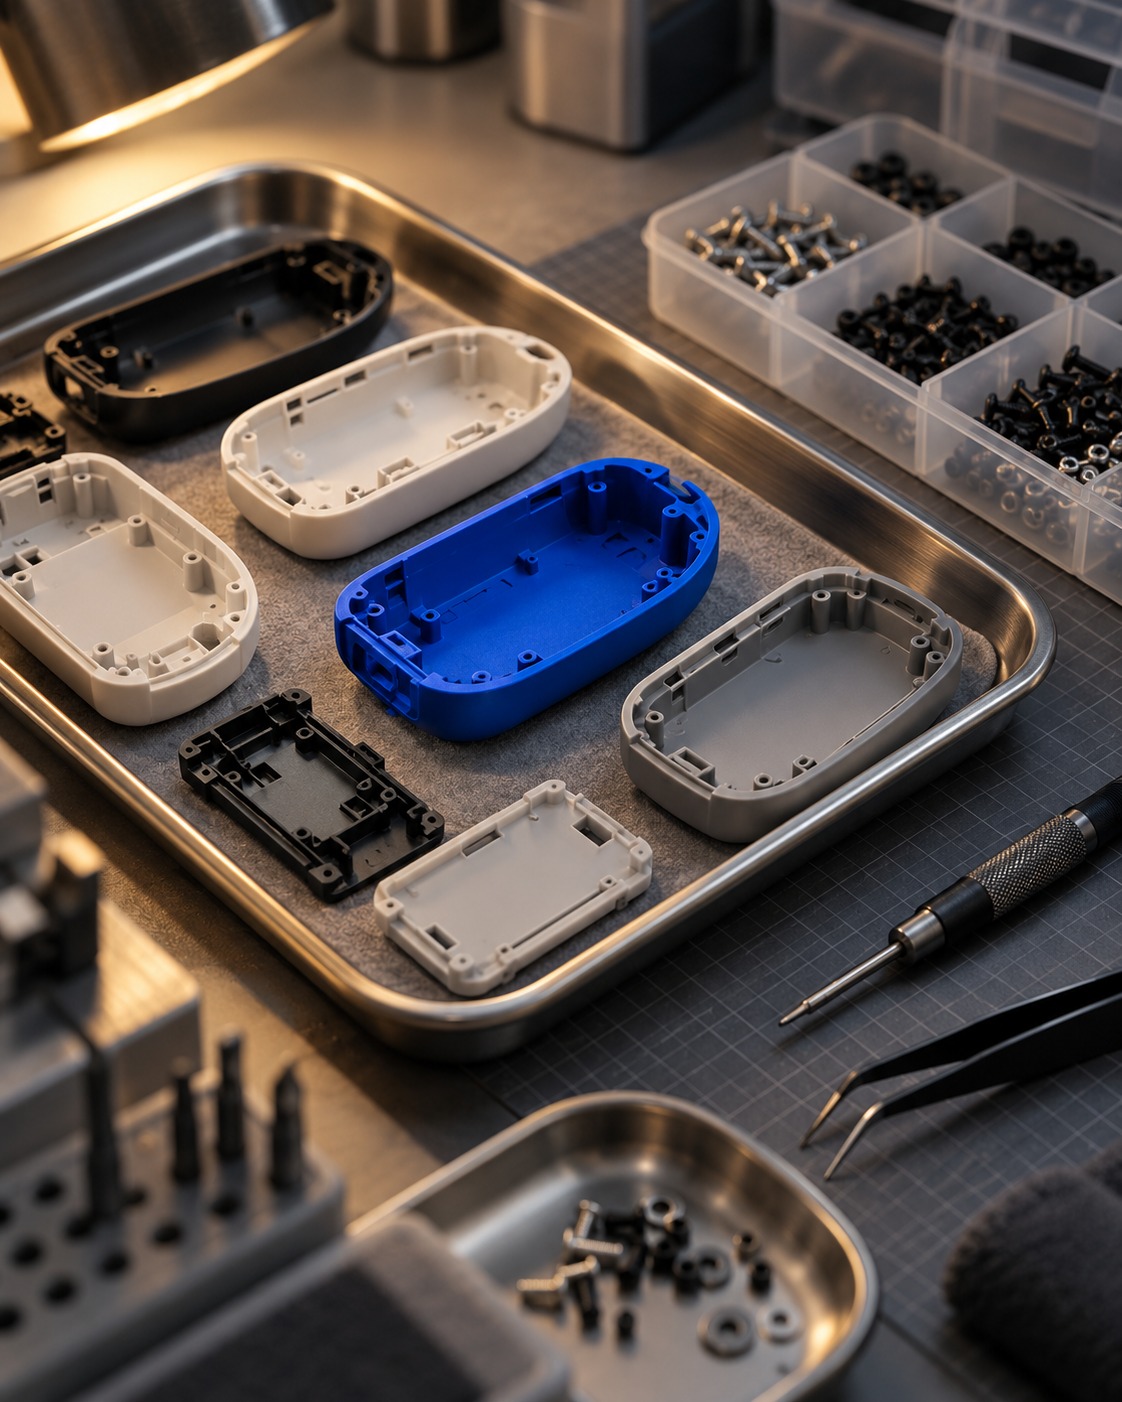
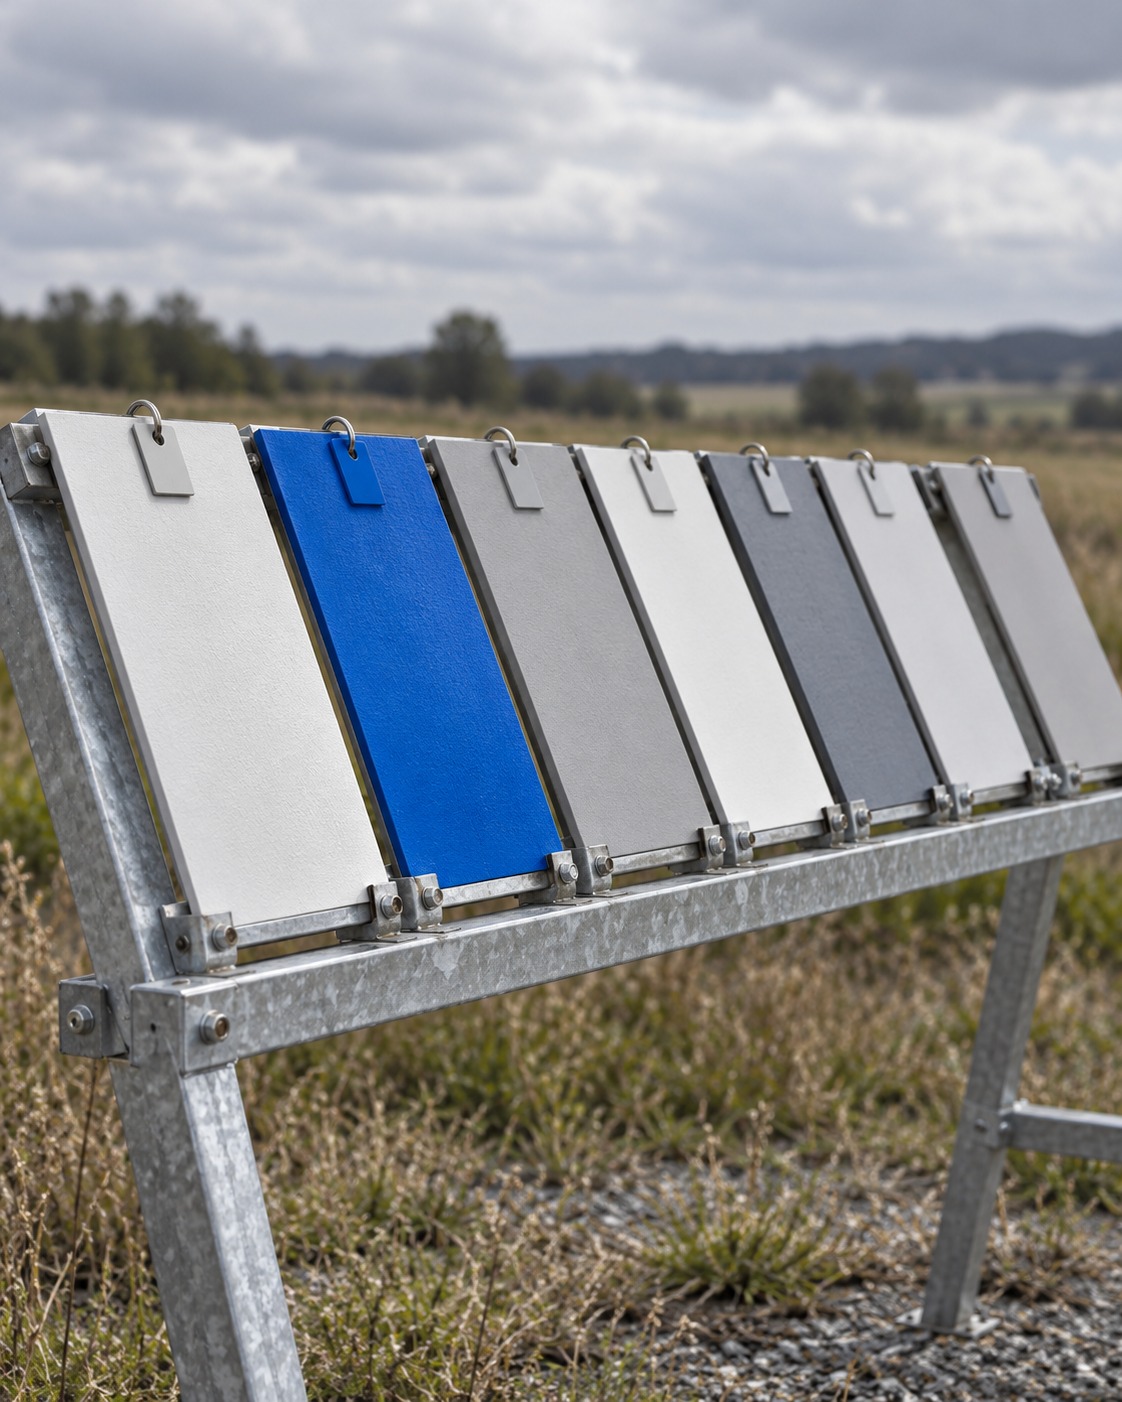
The first memory is a tender for urban furniture: children’s playgrounds. The specification included, as part of ideation and not as an appendix, repainting, material resistance, wear and replacement parts. That meant the design couldn’t settle for looking good on delivery day; it had to remain safe and usable after years of sun, rain, dust and children who don’t read manuals.
Thinking this way turns every decision into a maintenance question. Can the fasteners be reached without dismantling half the structure? Can the coating be renewed over the existing one or must it be stripped? How do you inspect a part that carries a child’s weight? Will spare parts exist in five years? These are design questions, not after-sales questions, because their answers change geometry, materials and joints.
A playground must remain safely usable after environmental exposure and repeated use. The sentence sounds like common sense, but it is a technical demand with a cost: it changes the process, the material, the finish and even how the product is packed and delivered. I don’t remember every decision of that project and I don’t want to attribute solutions to it that I can’t back up; what I keep is the lesson that asking about maintenance during ideation improves the product before it is manufactured.
There is a less visible consequence: whoever specifies maintenance is also specifying a long-term relationship with the customer. Someone will have to repaint, inspect and replace. Designing means deciding who will be able to do it and with what tools.

The second memory is a long-range hearing aid. I keep the name as it was used on the project, and I won’t go into technical specifications here: what matters for this chapter is that durability was in the specification from the very beginning.
Remarkably, the requirement accounted for wear of the technological components and the casings, and for their possible replacements. In other words, someone had accepted on paper that certain parts would degrade and that the product had to be designed so that degradation wouldn’t make it useless. In my experience that is not the most common thing: components and casings tend to be designed for the best first day, not for replacement.
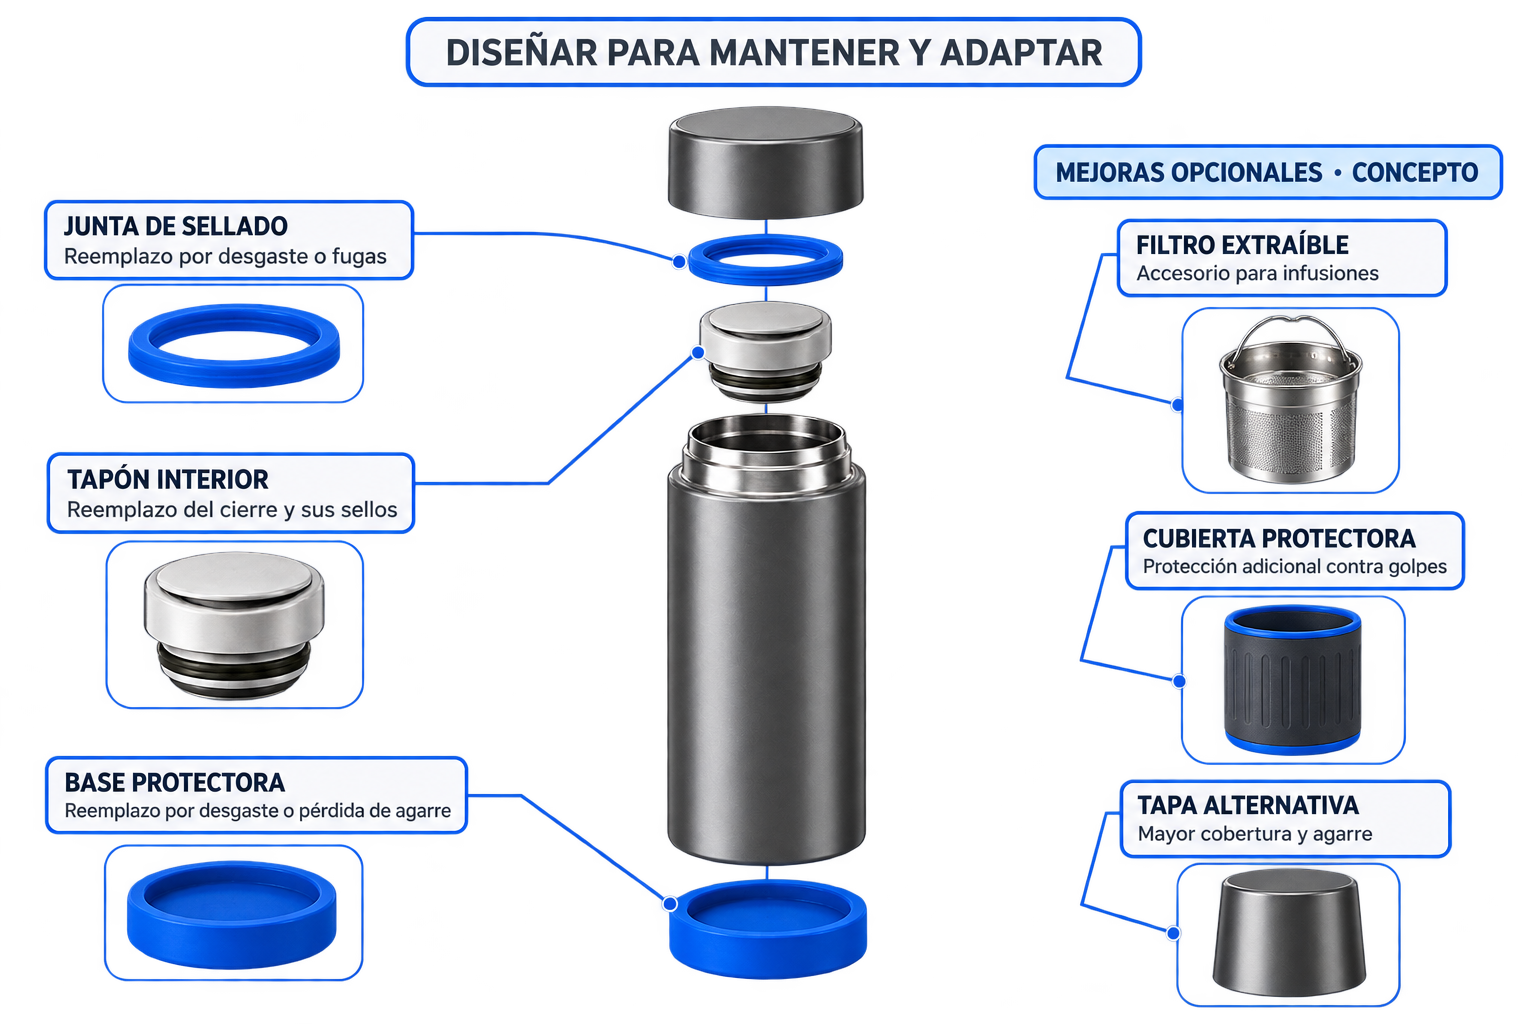
What links the playgrounds and the hearing aid is a simple idea: specifying maintenance changes materials, joints, access, modularity and sourcing. But there is a condition I learned to watch: repair has to be possible technically and economically. Having a spare part available is useless if taking the product apart costs more than replacing it; in that case the part exists and the repair does not.
Ever since, when someone shows me a product, besides asking who it is for and what it costs to make, I ask how it opens, who can open it and what happens when a part stops working.
A spare part is worth little if taking the product apart costs more than replacing it.— On repair that is actually possible
Repairability is a property of design, not of after-sales. It is decided when someone chooses an adhesive instead of a screw, a weld instead of a mechanical joint, or a casing that closes forever instead of one that opens with a common tool.
It is also decided in sourcing. A component can be replaceable on the drawing and not in practice if the supplier stops making it, if it is only sold in lots no workshop buys, or if the part costs more than the customer would pay to fix it.
That’s why it’s worth asking three things at once: can it be done, does anyone know how, and does it make economic sense. When all three answers are yes, maintenance stops being a hidden cost and starts being a feature of the product.


If we look at the automobile as a business model, something appears that design tends to overlook: a product’s economic value doesn’t end at the sale. Around a vehicle live the initial sale, parts, services, financing, insurance and other later revenue. And they are not the same for everyone: the profitability structure of a manufacturer, a dealer and a workshop are different.
That is why it’s worth avoiding two simplifications. One is saying that manufacturers no longer make money selling vehicles; the other, that all their profitability depends on maintenance. Neither is true in general. What I can say is that, for many durable products, an important part of the business happens after delivery, and whoever designs the product influences how it happens.
Here an idea from chapter 4 returns: needs are not always natural; sometimes they are designed. The critique of consumption rightly points at those who generate the offer. But it is worth separating four concepts that tend to get mixed up, because each asks a different question.
Table 6.1 — Four concepts not to mix up
| Concept | Key question |
|---|---|
| Wear and consumables | Which component loses performance because of its function and use? |
| Planned maintenance | How is it inspected, cleaned, adjusted or replaced to preserve the service? |
| Planned obsolescence | Is there evidence of a deliberate, unjustified limit on useful life? |
| Perceived obsolescence | Is replacement pushed even though the product still does its job? |
Fuel or air-conditioning filters help explain maintenance and saturation: a filter does its job precisely because it fills up. That it is replaced periodically doesn’t prove, by itself, planned obsolescence. The legitimate critique points elsewhere: barriers to repair, inaccessible spare parts, premature replacement, designs that force you to swap the whole to fix a part.
Maintenance can be an honest promise of service or an incentive to create dependence. The difference shows in the design, and when I bring a concrete case into this book I will document it.

In digital technology maintenance is even harder to design, because it can’t be seen. A physical object rusts, breaks, loses its paint; a system can be up and running and, at the same time, accumulating unlimited data, unsupported dependencies and unpatched vulnerabilities.
Methodologies include a complete cycle up to delivery to production. SSDLC, for example, stands for Secure Software Development Life Cycle. It is not a single methodology with an owner; it describes the idea of integrating security into the development cycle. It is different from SSDF, NIST’s Secure Software Development Framework (SP 800-218), which offers practices an organization can build into whatever development cycle it uses.
There are manuals, tests, checklists and an orderly handover, and still I see an enormous distance from real maintenance. The problem isn’t SSDLC: it appears when we treat delivery as a closing and assign the operation no capacity, budget, owners or learning.
The things we look at least in a technology implementation project are exactly the ones that weigh most afterwards: space, volume calculations, long-term security, operations maintenance and architecture maintenance. Many stakeholders don’t see them as part of the whole and they slip out of their business cases, because all of it costs, and costs more as usage grows.
Table 6.2 — Four planes of work after launch
| Plane | Work that continues |
|---|---|
| Operations | Incidents, support, backup, restore, continuity and procedures |
| Architecture | Capacity, dependencies, databases, compatibility, migrations and technical debt |
| Security | Vulnerabilities, patches, access, secrets and threat review |
| Experience | Accessibility, older devices, errors, updates and communication |
This connects with chapter 5: choosing APIs, data and constraints means anticipating what happens when a provider changes, retires a version or stops supporting a dependency. Digital materials age too.

In a physical product we study frequency of use, loads, environment and material resistance. Nobody designs a public bench without asking how many people will sit on it and in what climate. In a digital product the equivalent question is how much concurrency, how many requests, how much storage, how much transfer and how many dependencies it will support.
Today there are autoscaling services and serverless architectures, and that is great news. But it wasn’t always so, and even now what changes is how capacity is obtained, not its costs, limits or bottlenecks. A product can grow in users and lose margin if consumption per user, retries, support or paid third-party calls increase.
Nor is it wise to assume cost is proportional to usage. There are fixed costs, variable costs, capacity steps and economies of scale. And monthly active users (MAU) don’t measure load: two active users can consume very different amounts.
A simple model to estimate monthly request volume is the following:
where s is monthly sessions per user, a actions per session and k average technical requests per action. If profiles behave differently, compute by segment and add them up. Background jobs, bots and retries are estimated separately so they aren’t counted twice. Hypothetical example: with 8,000 MAU, 6 sessions per user, 5 actions per session and 4 requests per action, the volume is 960,000 requests a month.
For the peak the monthly total isn’t enough. Take the volume of a window and divide it by its duration, and with the average time in the system you get an approximate concurrency:
λ is the arrival rate per second; W, the average time in the system; L, the approximate average concurrency under stable conditions. It can’t be used to simply predict a queue that grows during saturation: by then the system is no longer in stable conditions.
Figure 6.7
This is where maintenance enters the business case. Product owners rarely keep it in mind, and yet usage volume can destroy a plan if costs and price aren’t balanced. The way to see it is to turn capacity and maintenance into variables.
The monthly cost of operating a product can be written like this:
F is fixed monthly costs; Σ qici, the consumption of each resource times its unit cost; H, operations and maintenance work; S, additional costs from capacity steps. The categories must be mutually exclusive to avoid double counting.
Um must represent a unit of value: a completed order, a processed document, a customer served. Successful and failed units are shown separately, so retries don’t look like productivity.
For a simple model with paying customers, net price P and average variable cost v, the break-even point is:
Ftotal gathers fixed costs and fixed maintenance. The expression only applies within a range where v and capacity stay stable, and free users’ consumption must be inside the model: paying customers and MAU are not equivalent. Hypothetical example: with 30,000 MXN of monthly fixed costs, 100 MXN of net revenue per customer and 40 MXN of variable cost, break-even requires 500 paying customers. If variable cost rises to 80 MXN, it requires 1,500, before adding new capacity steps.
If what you want is a target operating margin g, with costs defined for the scenario, the minimum price is:
I take the same hypothetical example: with 500 customers, Cm = 30,000 + 500 × 40 = 50,000 MXN. For a 20% margin, Pmin = 50,000 / (500 × 0.8) = 125 MXN. That price equals a 20% margin on revenue but a 25% markup on cost: they are not the same, and confusing them is a classic source of errors.
Passing costs on to the customer doesn’t automatically solve the business: price has to be checked against perceived value and willingness to pay. It is the same kind of analysis as chapter 2’s cost catalogue, with a line we didn’t used to look at: staying in operation.

Take an example I built for this book, not a case from a product of mine: an app for natural hazards and disasters. It is an extreme but realistic case. On a normal day it might get between 1,000 and 5,600 interactions; in an emergency, depending on the locality and the size of the event, easily 50,000. Before sizing anything you have to define what an “interaction” is and over what time window it happens.
Because 50,000 interactions spread over a day are not the same as 50,000 concentrated in ten minutes. In the second window it is about 83 per second, and you still have to multiply by the technical calls each interaction triggers and by retries. With, say, four requests per interaction it would be about 333 per second and, if each takes two seconds on average, around 667 in flight at the same time, under stable conditions.
But traffic is only one part. In an emergency telecommunications degrade, latency rises, batteries run low and external providers saturate. Scaling the server doesn’t repair a downed mobile network. Operations maintenance must anticipate caching, essential information available offline, the date of the last update, pending requests and controlled degradation: the product does less, but keeps doing what’s essential.
There’s also the human perspective. Can an older person recognize the alert, understand what to do and tell current information from outdated? Does it work on an old phone, with low vision or little digital familiarity? These questions are answered before launch and they are operations maintenance, almost always invisible.
And there’s updating. Server changes and remote configuration are not the same as a new app version, and it’s unwise to promise universal automatic updates. The prudent thing is to plan compatibility, gradual rollout and rollback, and to avoid requiring anyone to update the app to reach essential information during an emergency. Rehearsals happen in test environments: you don’t remove essential protection from a group of real users to see what happens.
Figure 6.9

A practical way to start is a three-year lifecycle map: volumes, form of use, user profile and incidents. It is not a closed prediction; it is a set of revisable hypotheses questioned every time new data arrives.
For each horizon it’s worth building three scenarios — low, expected and stress use — and recording user profile, volume, frequency, incidents, cost, security, dependencies, an owner and the threshold at which you intervene.
Table 6.3 — Three-year lifecycle map
| Horizon | Dominant question | Evidence and decision |
|---|---|---|
| Before launch | What do we need to sustain the service? | Load, accessibility, spare parts or dependencies, owners and budget |
| Year 1 | How is it really used? | Cohorts, consumption, incidents, wear, support and cost per unit |
| Year 2 | What changes with growth and aging? | Peaks, data retention, capacity, repair and supported versions |
| Year 3 | What do we renew, migrate or retire? | Replacements, migrations, end of support, provider exits and responsible retirement |
For a startup the horizon is shorter: a rolling twelve-month window, monthly review and quarterly decisions. MAU is usually measured there, but it should be accompanied by retention, sessions, consumption per segment, concurrency peak, support tickets and cost per unit of value. A short horizon doesn’t justify skipping hard-to-reverse decisions, such as data retention or a contractual dependency.
The three-year map isn’t written once: it turns in a cycle that repeats at every horizon.
01
Record real usage, volume, incidents and cost.
02
Build low, expected and stress scenarios.
03
Assign owners, budget and thresholds.
04
Compare what was planned with what happened, and adjust.

Maintaining a physical product relies on instruments: calipers or a micrometer for dimensional loss, a coating-thickness gauge, corrosion tests, load, fatigue or abrasion tests depending on material and function, and sometimes a scale, when mass loss makes sense. What matters is keeping a record.
Weight alone doesn’t measure every form of wear, so it’s worth noting the unit or batch, exposure conditions, use cycles, measurement method, instrument, its calibration where applicable and the acceptance criterion.
In digital there is a parallel, though not a literal equivalence: material wear and software failures are not the same thing. But both leave evidence that can be measured and documented.
Table 6.4 — Evidence of deterioration, physical and digital
| Physical product | Digital product |
|---|---|
| Visual inspection and repeatable photographs | Correlated event and error logs |
| Calipers or micrometer for dimensional loss | p50, p95 and p99 latency per journey |
| Scale for mass loss, where relevant | Storage, transfer and data growth |
| Coating-thickness gauge and corrosion tests | Versions, vulnerabilities and unsupported dependencies |
| Load, fatigue or abrasion tests by material and function | Load, stress, recovery and endurance tests |
| Repair time and cost; parts availability | Recovery time, support, rollback and cost per operation |
In digital, availability is defined through successful critical journeys, service level objectives (SLOs) and actionable alerts. A running process doesn’t guarantee the user can complete their task. You also need to keep records of versions, incidents, architecture decisions and recovery procedures that have actually been tested.
To make a service traceable there are free and commercial options. OpenTelemetry is an open standard for instrumenting and exporting metrics, traces and logs; by itself it isn’t a place to store and query them. Prometheus and Grafana OSS cover metrics, alerts and visualization with free software, and Grafana Loki and Tempo add logs and traces that can be linked to metrics. Free doesn’t mean free to run: hosting, storage, retention and maintenance all cost money.
Among commercial options, two names that come up often are Datadog and Dynatrace. According to the vendors’ own press releases, both were recognized as Leaders in Gartner’s 2026 Magic Quadrant for Observability Platforms, published in July 2026. It is a useful data point to guide a search, not a recommendation: Gartner itself states it doesn’t advise choosing only the highest-rated vendors, and no position guarantees a platform fits your product or your budget.
Traceability should let you follow an operation across several services through correlated identifiers, without turning logs into an indiscriminate store of personal data. And the cost of observing belongs in the business case too.
Table 6.5 — Instrumentation and observability options
| Option | Intended function | Consideration |
|---|---|---|
| OpenTelemetry | Instrumentation and export of metrics, traces and logs | By itself not a backend to store and query them |
| Prometheus + Grafana OSS | Metrics, alerts and visualization | Free software; hosting and maintenance cost money |
| Grafana Loki and Tempo | Logs and traces linkable to metrics | Size storage, retention and operations |
| Datadog | Commercial observability platform | Leader in Gartner’s 2026 Magic Quadrant, per the vendor’s press release |
| Dynatrace | Commercial observability platform | Leader in Gartner’s 2026 Magic Quadrant, per the vendor’s press release |

With a physical product you can install pilot units or follow-up groups exposed to known conditions and review them at a defined frequency. It’s worth reserving the phrase “control group” for comparisons that really have a control and a measurement design; following units in the field is valuable, but it isn’t the same as a controlled experiment.
In digital something similar happens. Cohorts, pilots and gradual rollouts are used to detect support needs, degradation and differences between profiles. An A/B test can evaluate a specific change, but it doesn’t replace recovery, security or capacity tests. And it’s worth comparing devices, networks and usage patterns so you don’t attribute to the change what belongs to the context.
All of this forms a learning cycle: measure, interpret, decide, verify. On each turn you document the problem, the evidence, the hypothesis, the intervention, the owner and the result, and you check whether the fix improved the experience and reduced the cost of sustaining it. Maintenance design doesn’t end at launch: it is an iterative process of constant learning.

I come back to the playgrounds and the hearing aid. In both cases, thinking about life after the debut changed both the object and the service that came with it. That is the part that excites me most today: maintenance isn’t only a cost to manage; many times it is a source of opportunities.
Repair, refurbishing, spare parts, extended useful life, specialized support, service levels with differentiated cost by type of customer. In digital, maintenance evidence also reveals new segments, integration needs and operational services nobody imagined at launch: market diversification born from real use.
With one warning: the opportunity to charge for an additional service is one thing and the incentive to create dependence or avoidable failures is quite another. Support tiers can vary in accompaniment or response times; basic security obligations must be met for every customer.
Designing a product is also designing how it will keep being useful.— Closing the chapter
When maintenance is documented from the launch project, it stops depending on someone remembering to solve it later. It starts to be part of decisions about materials, architecture, price and service.
And when we observe how the product really lives, we find more than problems to fix: we find opportunities to preserve its value, widen its market and build a longer-lasting relationship with the people who use it.
My recommendation is simple: keep it in mind from the launch project and document everything as part of the product vision. The rest — the three-year map, the formulas, the tools — are ways of making sure that decision doesn’t depend on anyone’s memory.